Designed for Programme Managers
You can't see the forest for the trees. Data scattered across projects, no visibility into systemic patterns.
Programme managers can see project risks rolled up into one portfolio view, making escalations and recurring themes easier to review.
Enquire about KinetiRisk for your organisation →How KinetiRisk Helps
KinetiRisk rolls up risks from all your projects in real time. See which programmes are in trouble, spot systemic themes, and focus your support where it matters most.
Portfolio Heatmaps
Probability × Impact matrix rolls up from project to programme to portfolio. Drill into any cell to see member risks.
Systemic Risk Areas
KinetiRisk automatically groups your risks into systemic themes — Staffing gaps, Regulatory pressure, Legacy infrastructure. Example: if three projects flag 'key person dependency', that surfaces as a single systemic area needing portfolio-level action.
Live Escalation Feed
Automatically updated dashboard shows recent escalations across all programmes. No polling, no manual updates.
Cross-Programme Visibility
See all active risks grouped by programme. Compare risk intensity, mitigation progress, and escalation status.
See It in Action
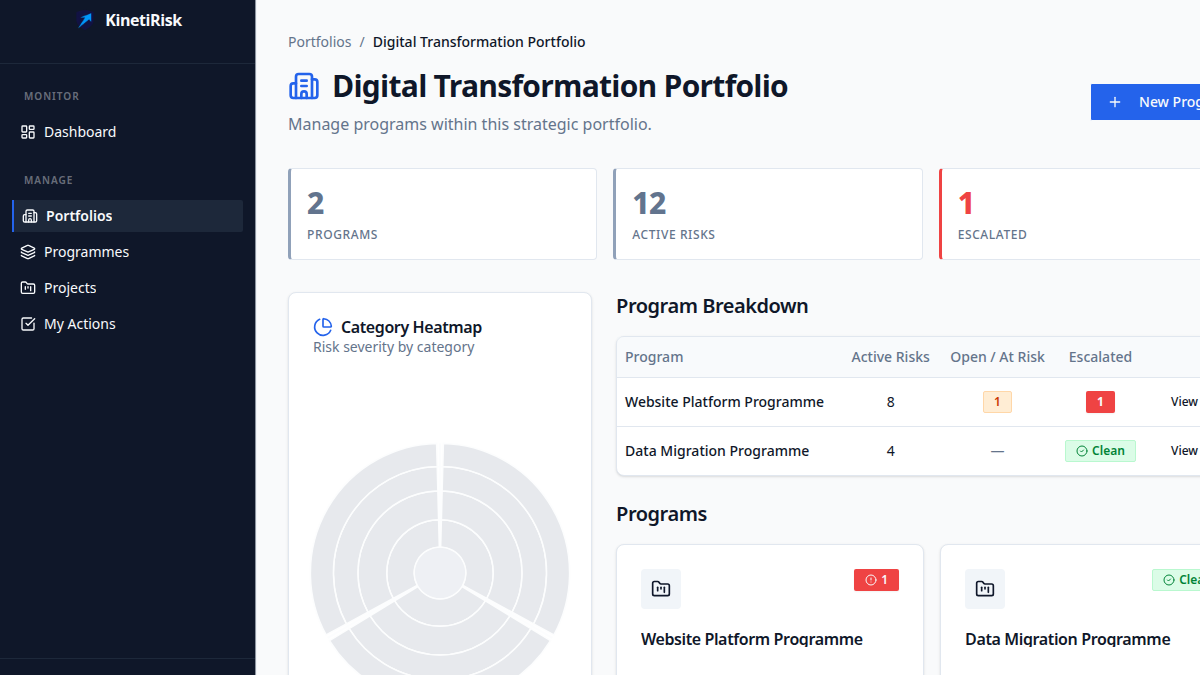
Structure your portfolio hierarchy
Organise programmes and projects under a single portfolio. Every project's risks flow up automatically — nothing slips through the gaps.
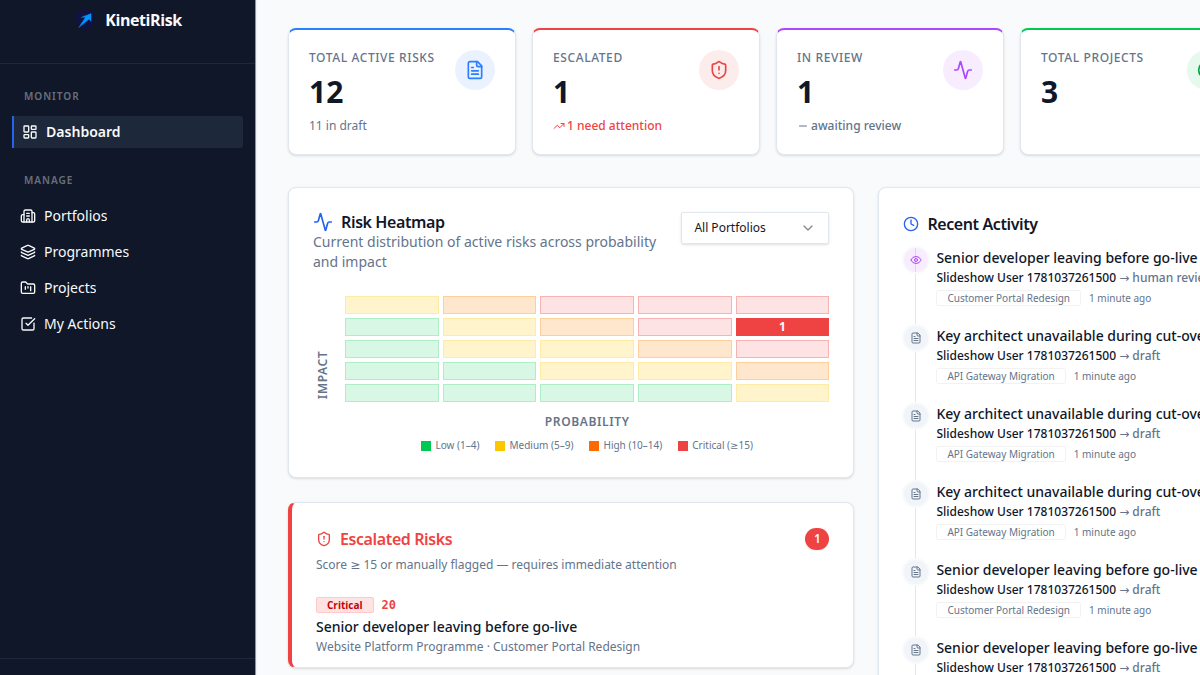
See risk intensity across the portfolio
A 5×5 probability × impact heatmap rolls up from every project in real time. Click any cell to see the risks driving that score.
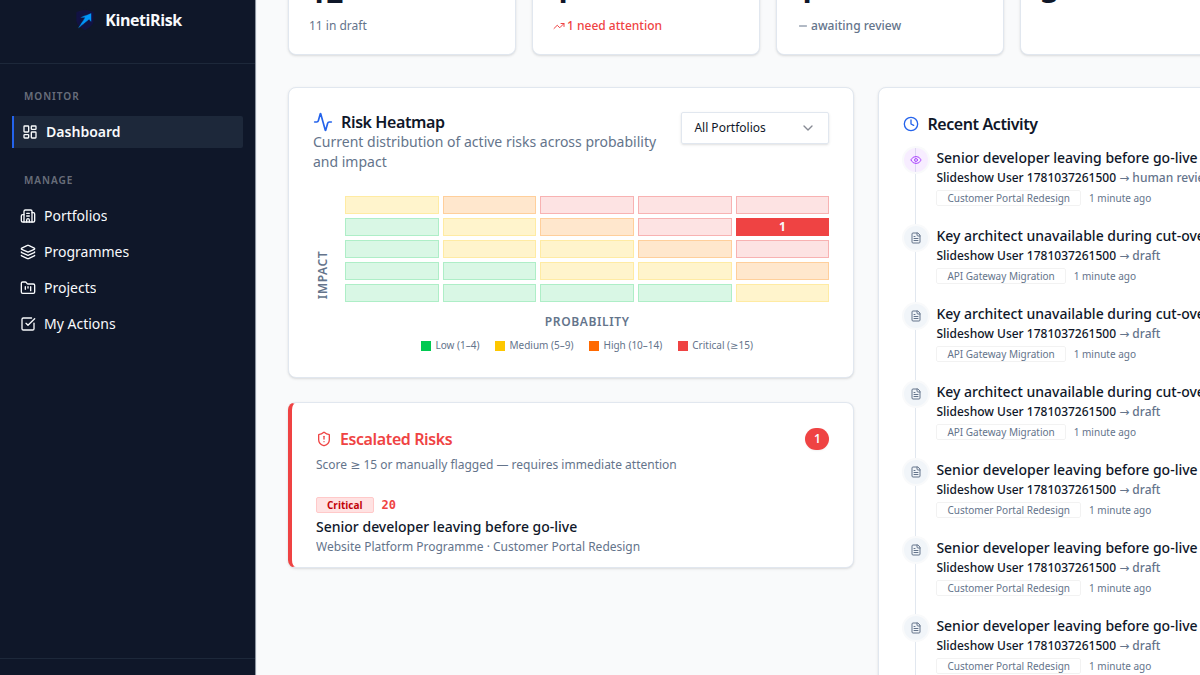
Stay on top of escalations instantly
A live escalation feed surfaces every high-severity risk across all your programmes the moment it is flagged. No polling, no manual chasing.
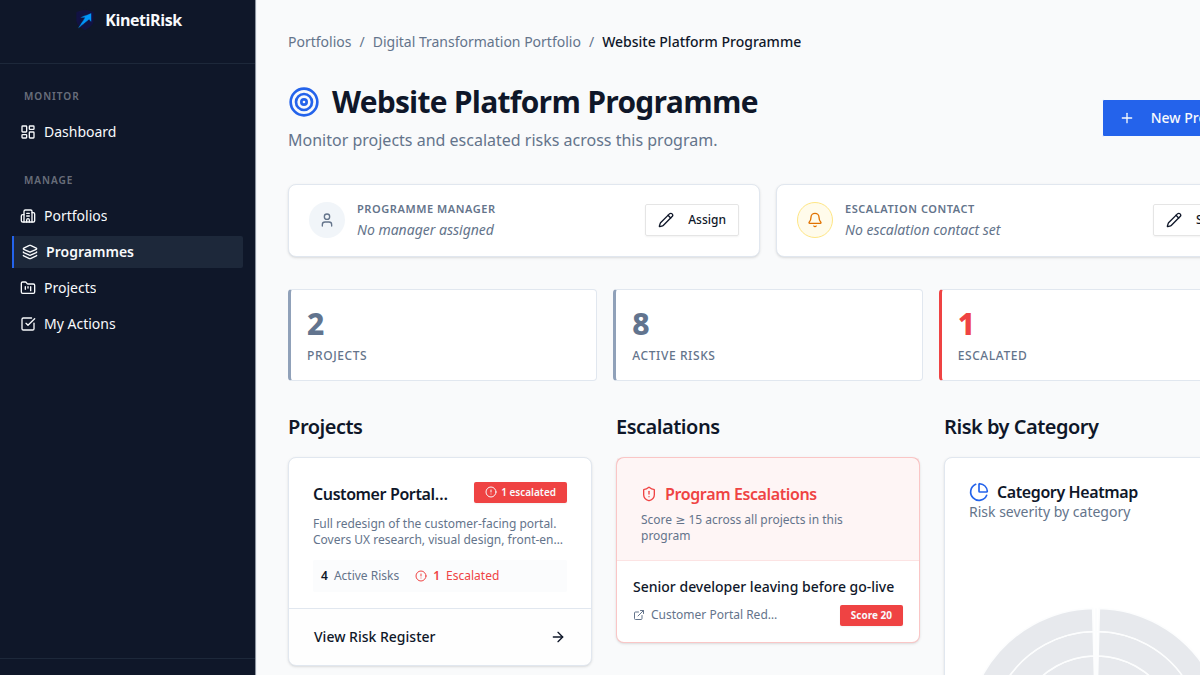
Monitor mitigation progress at scale
See action status, owner, and completion percentage across every project in your programme. Spot the bottlenecks before they become problems.
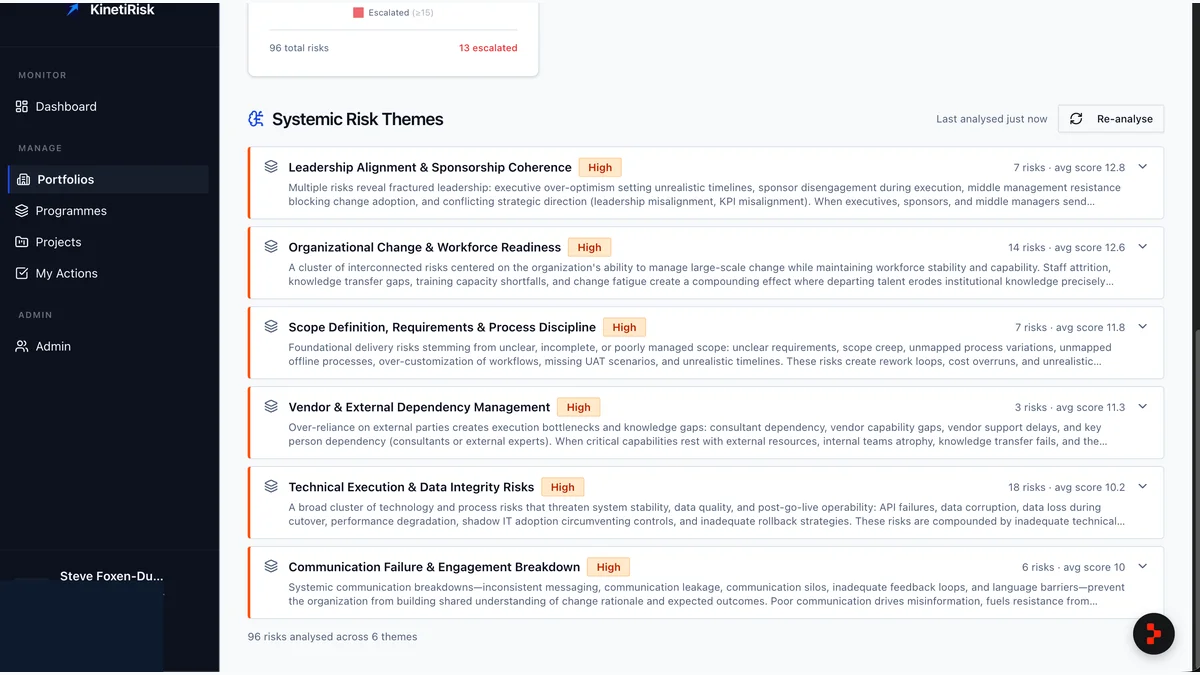
Spot systemic risk themes early
KinetiRisk clusters risks across projects to surface portfolio-wide patterns — staffing gaps, regulatory pressure, delivery blockers — so you can act at the right level.
What KinetiRisk does
AI scoring with reasoning
Probability and impact are proposed from a plain-English description, with the reasoning shown. A person reviews and approves the result.
Mitigation planning
Each analysis suggests mitigation actions, with a recommended owner role for each one.
Automatic escalation
A risk scoring 15 or more (probability times impact) is escalated automatically and an email alert is sent. Escalation is threshold-based, not decided by the AI.
Residual risk forecast
The score you can expect once the mitigation actions are complete, so you can see how far the plan has moved the exposure.
Board narrative
A written summary with a RAG status and the top risks, ready to paste into a board pack or steering committee update.
Portfolio view and clustering
Risks roll up from project to programme to portfolio, and related risks are grouped to surface systemic themes.
Mitigation progress tracking
Action status, owner and completion across every project in a programme.
Risk change history
Every change to a risk is recorded with a timestamp and the person who made it.
Response strategies and review reminders
Classify each risk with a PMBOK or PRINCE2 response, and set review dates that remind the owner by email.
Read our risk management blog
Practical insights on AI scoring, escalation workflows, and portfolio governance.
Browse articles →